Course · Module 1 · Lesson 3
Configuring for your market and timeframe
The defaults are a sensible starting point, but the readout gets genuinely good only after matching it to your market and your horizon. Open the indicator settings (gear icon next to its name on the chart).
Three settings that matter most
1. Distance filter (maxDistPct). The table shows only zones closer than X% from price. Too wide = noise from levels that won’t be in play for weeks; too tight = an empty table in a quiet market. Rule of thumb: high-volatility instruments (crypto) tolerate a wider filter than calm blue chips.
2. View elements. Three toggles:
showTable— the zone table (default ON),showLabels—Σ · %labels at levels (default ON),showLabelNames— the per-indicator breakdown (default OFF; switch it on while studying module 2, then back off),- show all source indicators — reveals the full set of indicators the levels are computed from; great for learning, cluttering day-to-day.
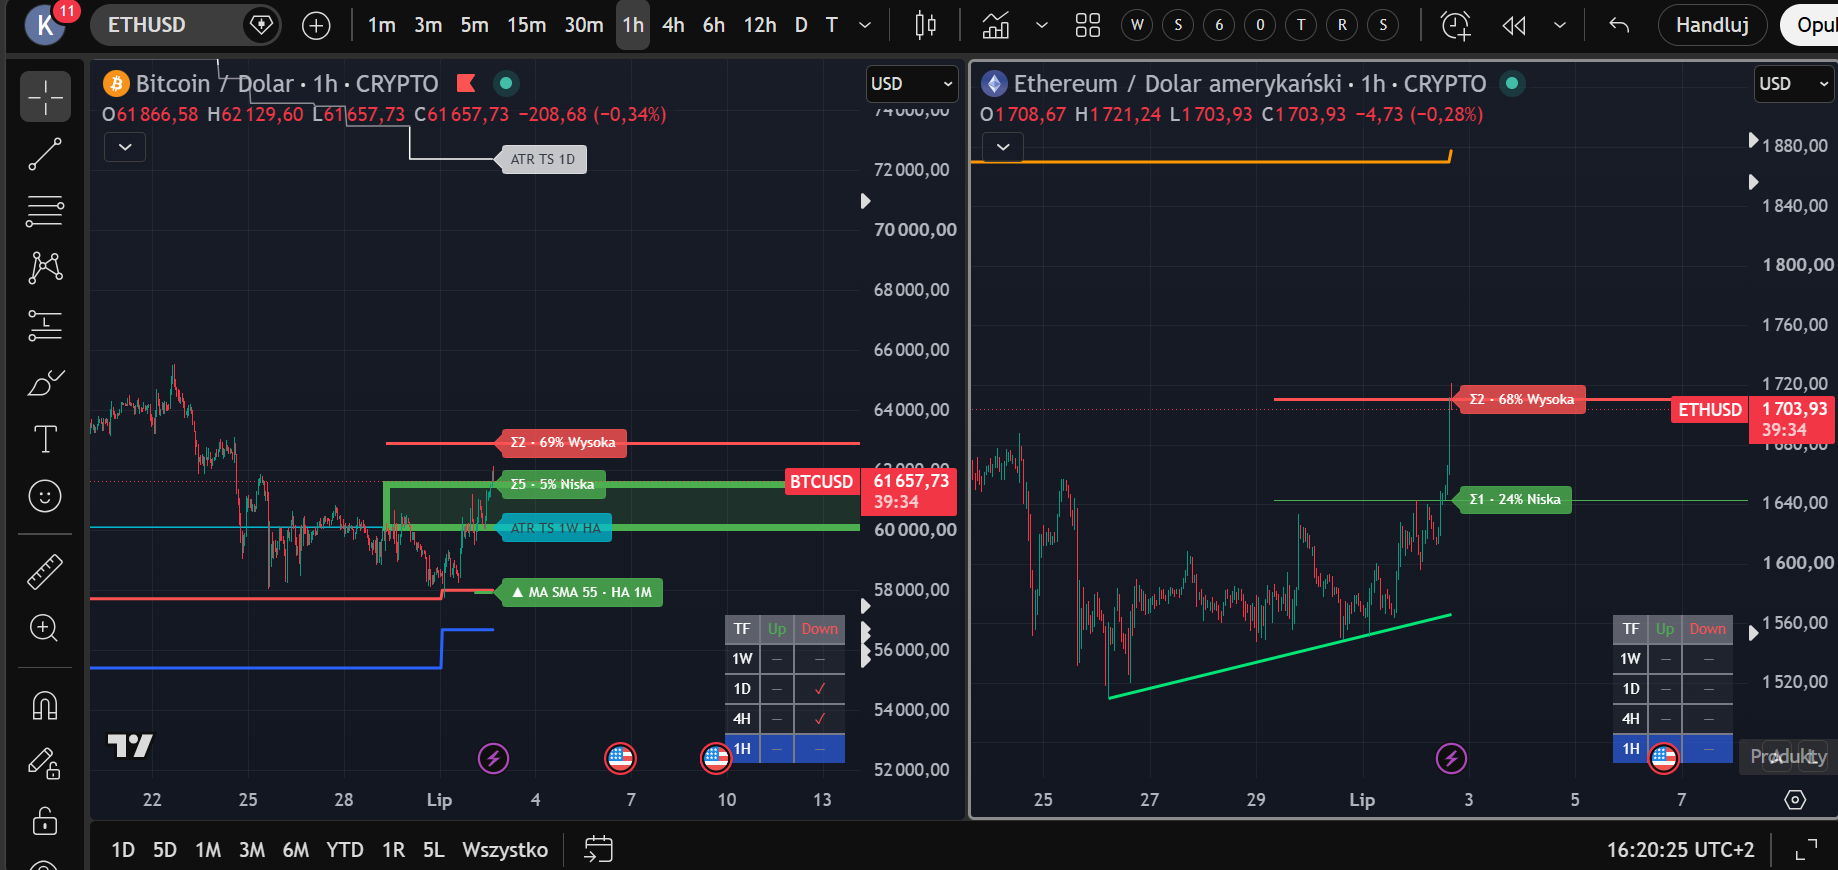
This is the toggle in action: every line labelled with its source (ATR TS 1D, ATR TS 1W HA, MA SMA 55 · HA 1M). When we take zones apart in module 2, this view will be your main learning tool.
3. Moving averages. Four MA slots, each with independent type, timeframe and length. The default set covers the classics; if your market respects a particular average (e.g. the daily MA200 on US stocks is watched by half the market), make sure it’s in the set.
Cross-market BTC ↔ ETH
Open a BTC or ETH chart and the dashboard auto-detects the ticker, adding the paired market’s readout. The logic: BTC and ETH move in strong correlation, so a zone confirmed on both markets matters more than one visible on a single market. On other instruments the module stays inactive — nothing to switch off.
Two starter presets
Crypto swing (BTC/ETH, decisions on 4H–1D):
- Chart: 4H or 1D.
- Distance filter: wider — crypto can cover several percent in a day.
showLabelsON,showLabelNamesOFF.- Alerts (lesson 4): zone entry — both sides of the market.
US stocks (blue chips, decisions on 1D):
- Chart: 1D.
- Distance filter: tighter — 2–3% on a calm stock is a real move.
- Mind MA200/MA50 on 1D in the MA slots.
- Remember opening gaps: a zone can be jumped by a gap, and the “zone entry” alert will only fire at the session open.
Treat the presets as a starting point — after module 2 (where zones come from) you’ll be able to judge consciously what to keep and what to change.
Save your layout
Once configured, save the chart template in TradingView (chart layout menu → save). Every new chart then opens with the readout ready, and settings experiments won’t overwrite your base.
Lesson 3 checklist: distance filter matched to the instrument’s volatility → view limited to the elements you use → a preset chosen and saved as a chart template.
Educational material. Not investment advice. Example configurations illustrate how the tool works; they are not recommendations.