The tool
S/R Warning Dashboard
MarketSonar S/R Dashboard is an overlay indicator for TradingView. It collects support and resistance levels from several independent indicators, groups nearby same-side levels into zones, and shows each zone's summed strength Σ plus a percentage breakout chance.
Where zones come from
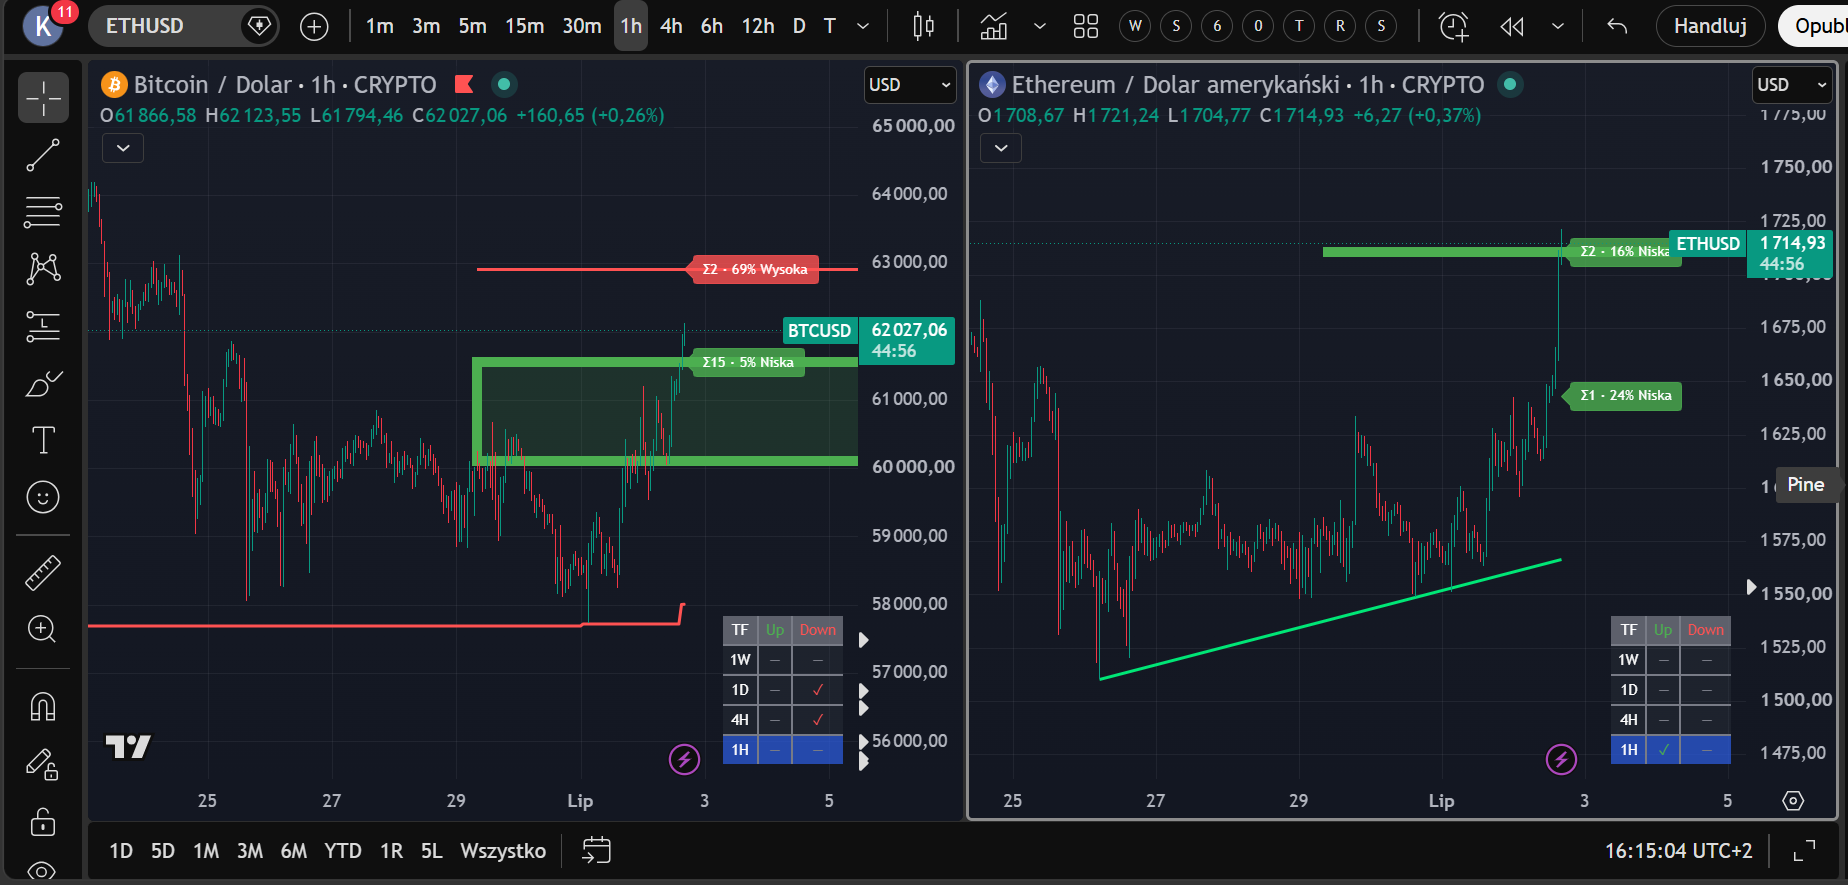
- ATR Trailing Stop (UT-bot) — monthly and weekly, on regular candles and Heikin Ashi.
- Heikin Ashi levels on regular candles — HA variants are computed in parallel, so zones you'd normally see only after switching the chart to Heikin Ashi are here immediately — no chart-type change.
- 4 moving averages — type, timeframe and length set independently.
- Pivot Boss Camarilla H3/L3 — monthly and weekly levels.
- Multi-TF trendlines — auto-detected across timeframes (1W–1H), with a table showing where a trendline is active and which way it points.
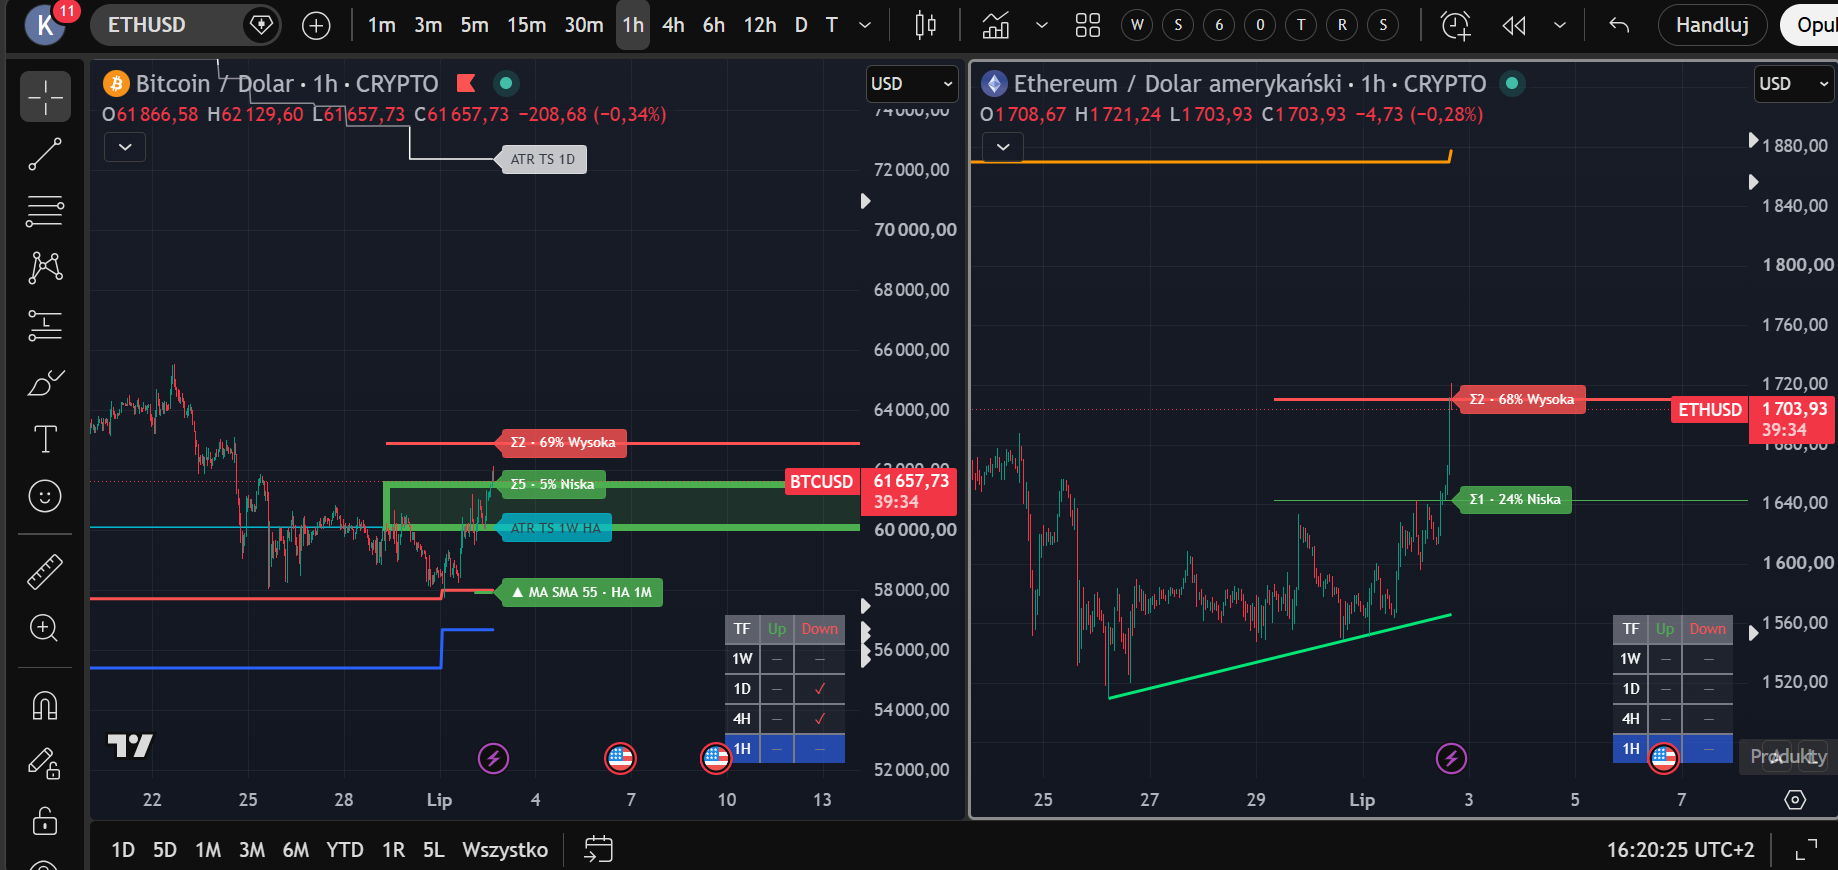
- Cross-market BTC ↔ ETH — ticker auto-detection; the paired market weighs into the zone score. Two windows side by side — BTC and ETH — give a full view of crypto's key zones, because the two markets influence each other.
How Σ is computed
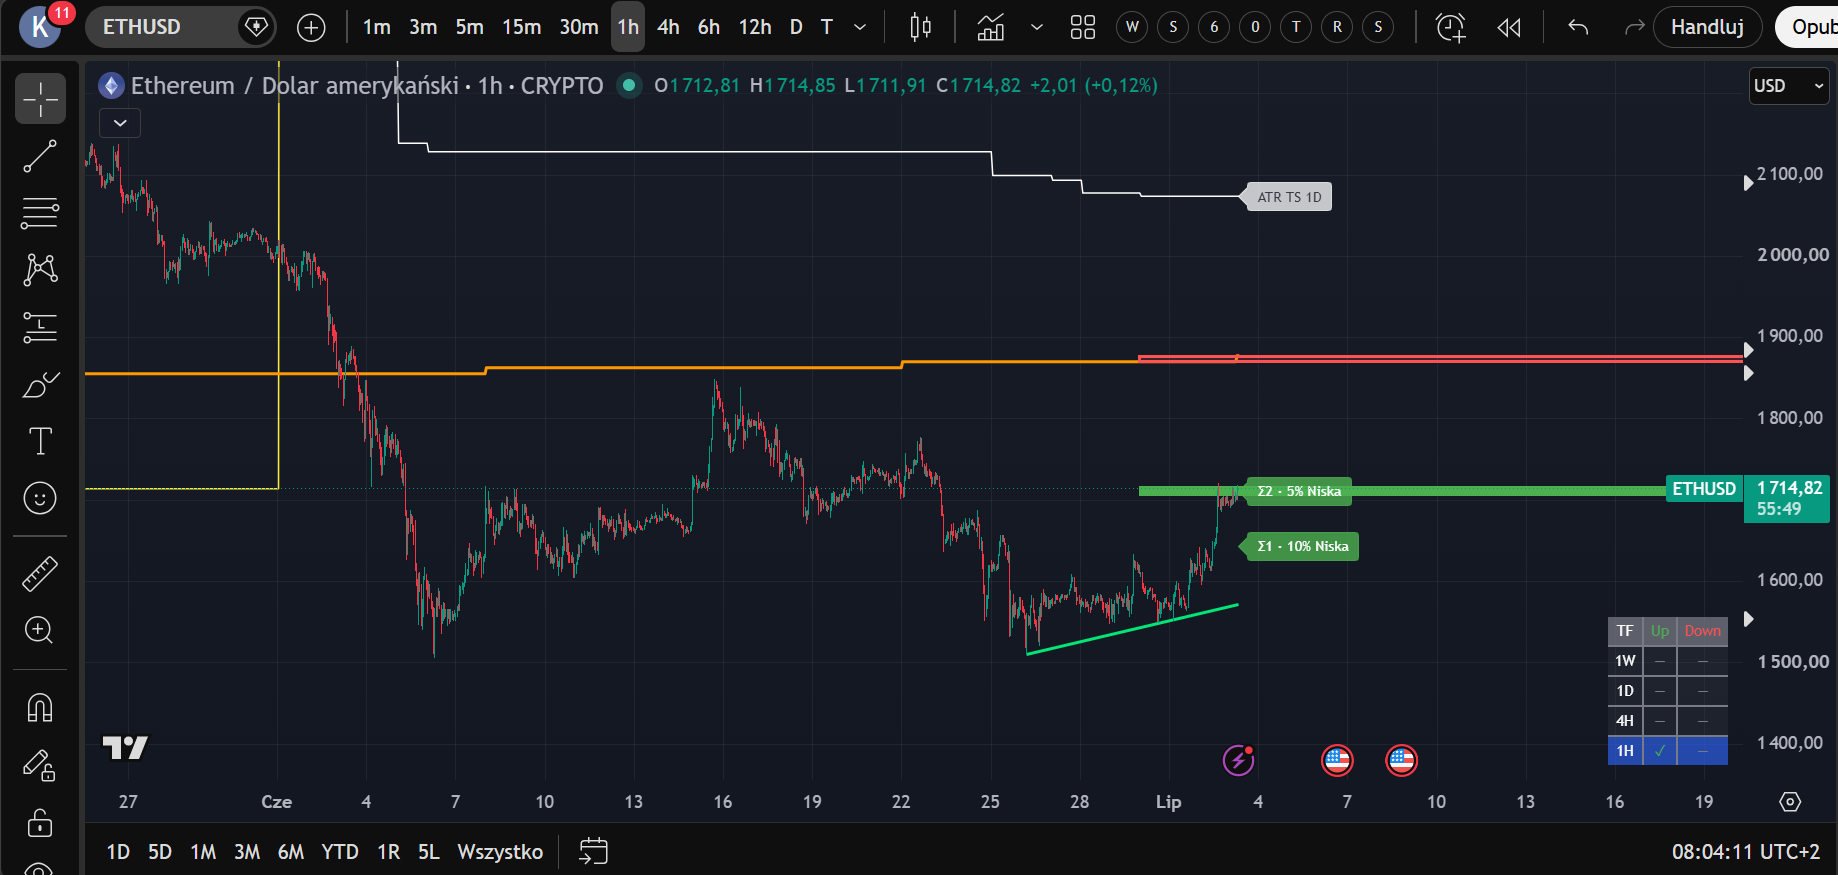
Each level scores by timeframe (12M = 6 … ≤1D = 1), adjusted by indicator type (trendline +1, ATR TS 0, MA −1, pivot −1; minimum 1). Grouped levels sum into Σ — the higher the sum, the more independent methods point at the same area.
Breakout chance
A heuristic: base 50 + trend pressure (ADX/DMI, computed locally) × 40 − (Σ − 1) × 8. Labelled High ≥ 66, Medium ≥ 40, Low < 40. It measures context, not the future — the course teaches you how to interpret it.
What you see on the chart
- A 7-column zone table with a max-distance filter.
- Labels at levels: Σ{sum} · {chance}% {level}; optional per-indicator breakdown.
- The nearest S/R zone drawn as a box or line.
- 4 alerts: zone entry (R/S), breakout up/down.
- Trendline table: which timeframes (1W / 1D / 4H / 1H) currently have an active trendline and whether it points up or down. This is confluence distilled: confirmation from several timeframes at once, without a single chart switch — context that normally takes six clicks sits in one small table.
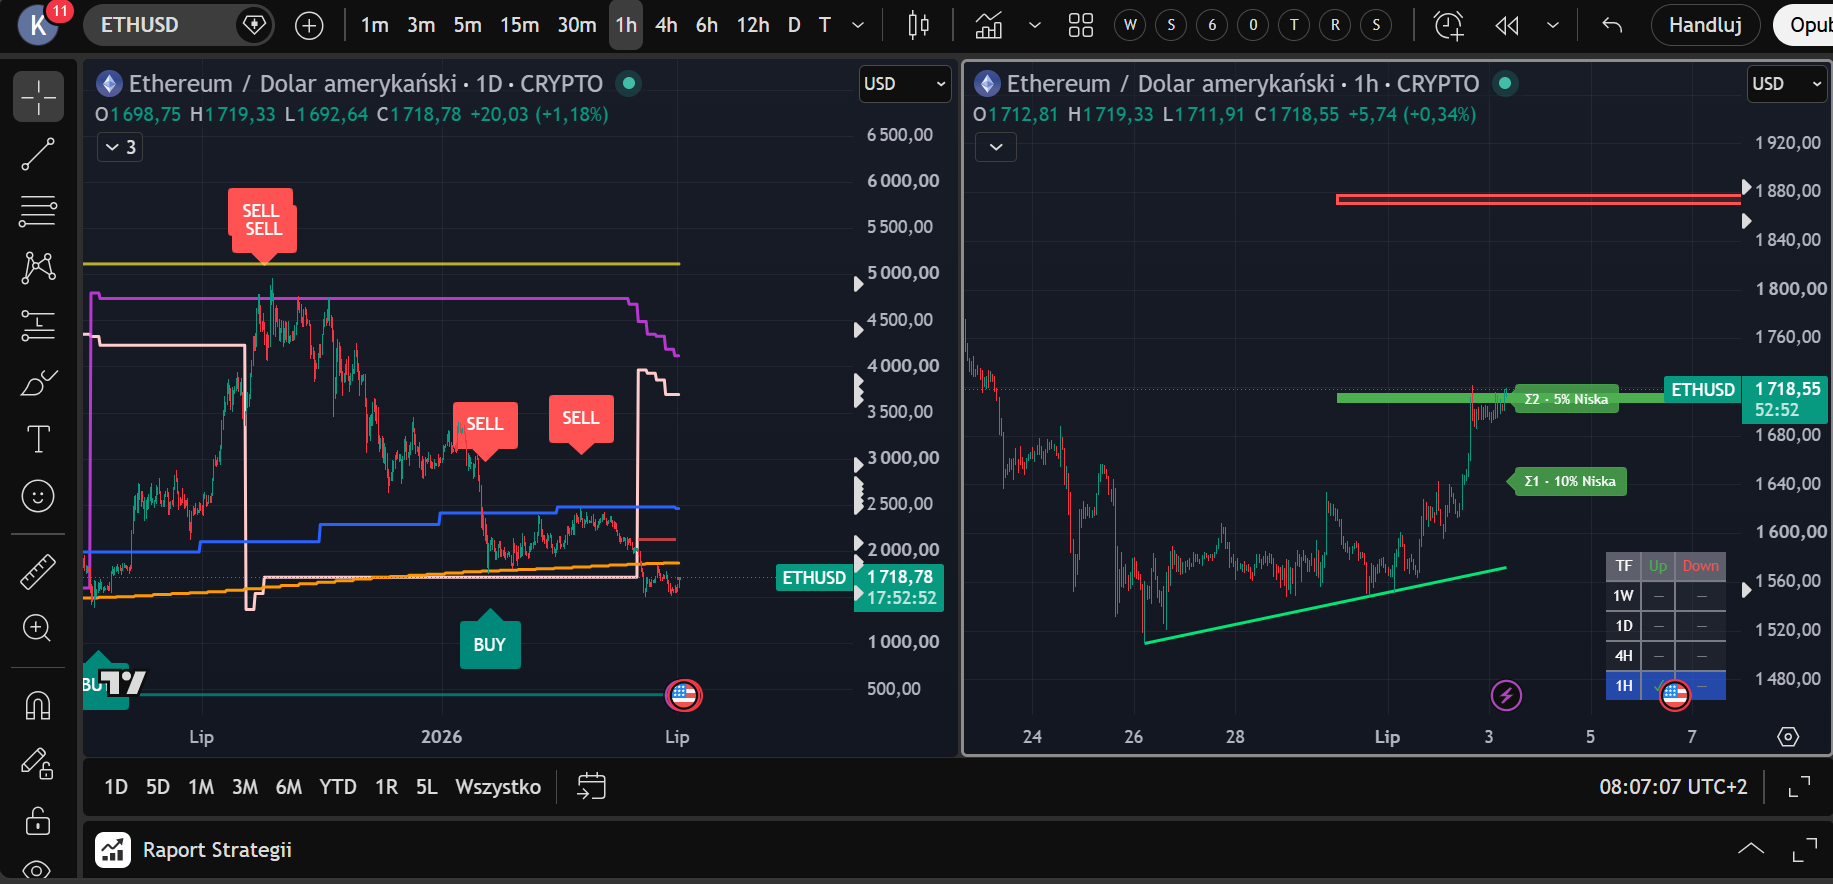
- Original indicators, not just zones: levels that stopped price within 10% of the current price are drawn in their native form (ATR TS line, moving average, pivot) with a source label — e.g. "ATR TS 1W HA" or "MA SMA 55". You see not just where a level is, but what it is.
- Show all source indicators: one toggle reveals the full set of indicators the script uses — for learning and independently verifying every level.
Honest about the limits
- MA and ATR-TS levels on a still-forming higher-timeframe bar can shift until that bar closes (repaint). We state this openly and teach you how to work with it.
- Breakout chance is a statistical-context heuristic, not a prediction.
- The tool buys and sells nothing — turning analysis into a decision is on you.
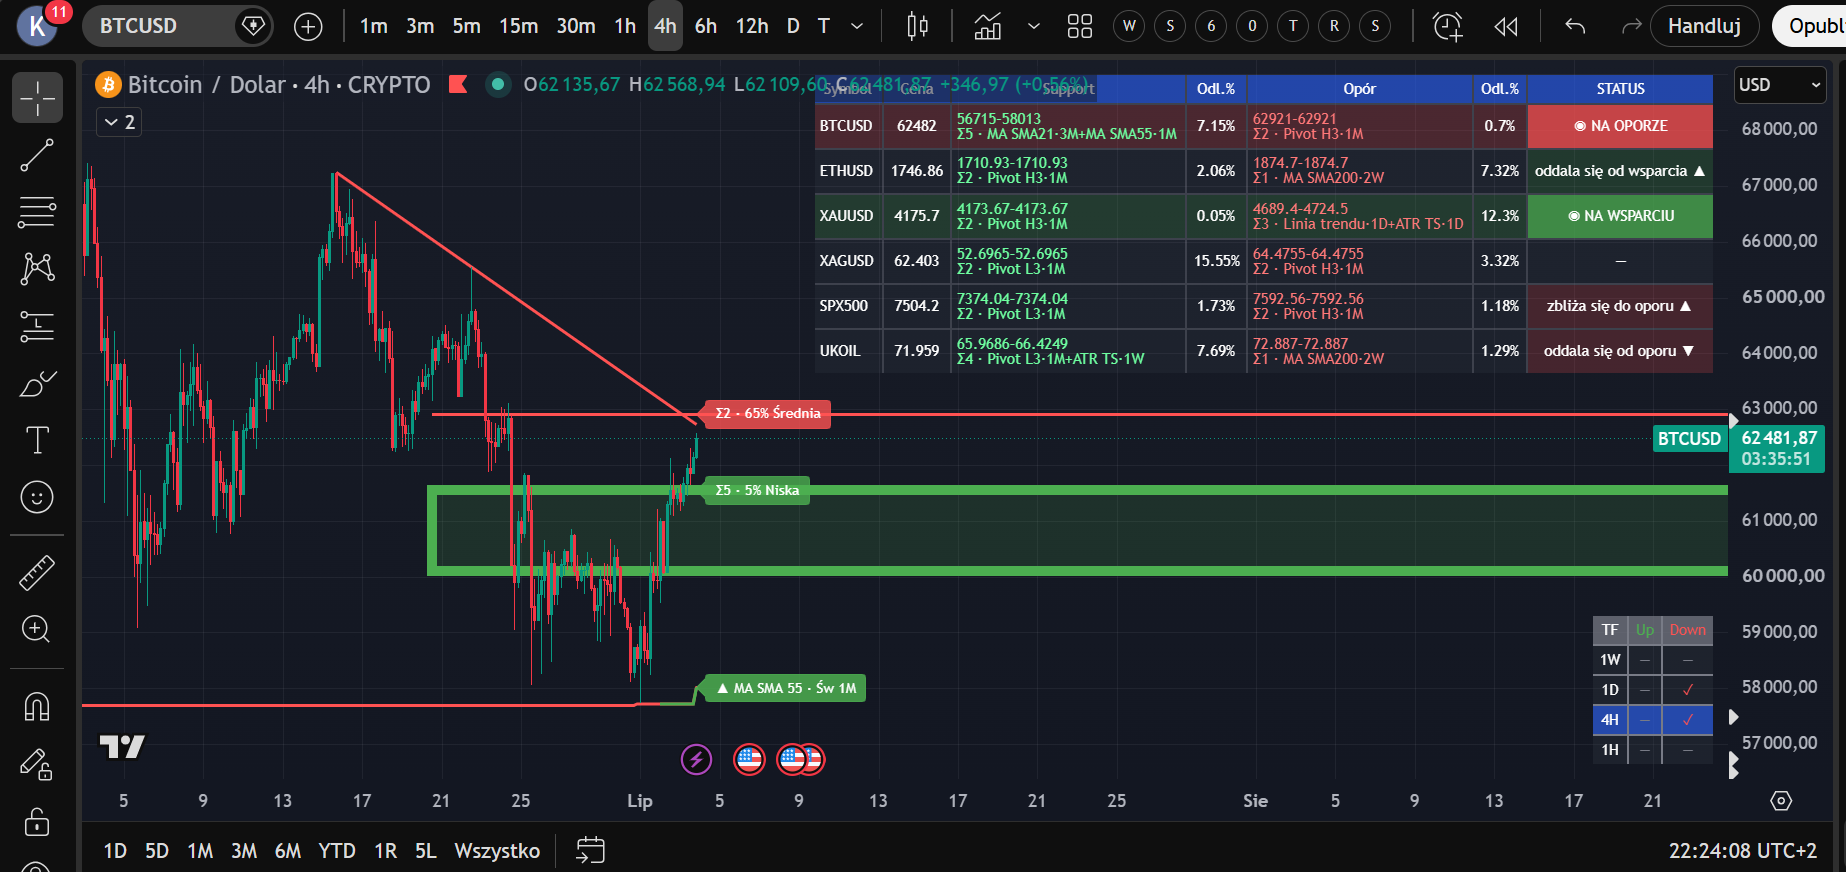
Multi-Market S/R Screener (Pro plan)
The second script in the Pro bundle answers the question the dashboard doesn't cover: what's happening on the other markets while you watch one? The screener monitors up to 8 configurable markets at once — by default BTC, ETH, gold, silver, the S&P 500, Brent oil and coffee — using the same zone engine as the dashboard (moving averages, ATR Trailing Stops 1M/1W/1D, Camarilla, trendlines, Σ scoring).
- One table instead of eight charts: for each market the nearest support and resistance (range, Σ, component indicators) plus the distance in percent.
- Directional statuses: "◉ AT SUPPORT / AT RESISTANCE" (fully highlighted row, 1% threshold), and within 3% the status also says WHERE price is heading: "approaching…" when it moves toward the zone, "moving away from…" when it retreats, "near…" when there's no clear direction.
- Honest side flips (support ↔ resistance): a zone changes side only when a confirmation-timeframe candle (default 4H) opens and closes entirely on the other side of the level. A piercing candle yields a "⚡ broken" status and a faded zone — no premature flips.
- One source of truth: statuses are computed from the candles of the feed set in the slot, so they're identical no matter which chart you're viewing; the table warns when the slot feed differs from the chart feed.
- Verification table: full attribution — every indicator per symbol with its value, distance and a ★ marker when it co-creates the STATUS. You can check for yourself where every message comes from.
- One alert for everything: dynamic per-market messages ("XAUUSD: price entered SUPPORT zone Σ2…") — a single TradingView alert covers the whole set, with a minimum-Σ filter.
- Configurable symbol slots: swap the feed or the whole market — the screener computes zones the same way for any instrument.
What about the ATR strategy? (joins Pro after validation)
The strategy engine — multi-TF ATR trailing stops with confluence layers — joins Pro at no extra cost once no-repaint becomes the default mode and out-of-sample validation is complete. We won't sell a backtest we can't defend ourselves: you buy Pro today for the dashboard and the screener; the strategy arrives when it can stand on its own.
The screener already covers commodities and the US500 index today. The Pro roadmap further includes dedicated scripts: altcoins accounting for BTC dominance, plus deeper US-stock and commodities modules with a calendar of key world events. Release order depends on validation — we don't promise dates, we promise quality.