A sonar that warns you before price hits the levels that matter
MarketSonar merges ATR trailing stops, moving averages, Camarilla pivots and trendlines into readable support/resistance zones — with a strength score Σ and a breakout probability. You learn to read the market. The decisions stay yours.
Runs on TradingView · candles & Heikin Ashi · BTC/ETH and US stocks
01 · Straight from a live chart
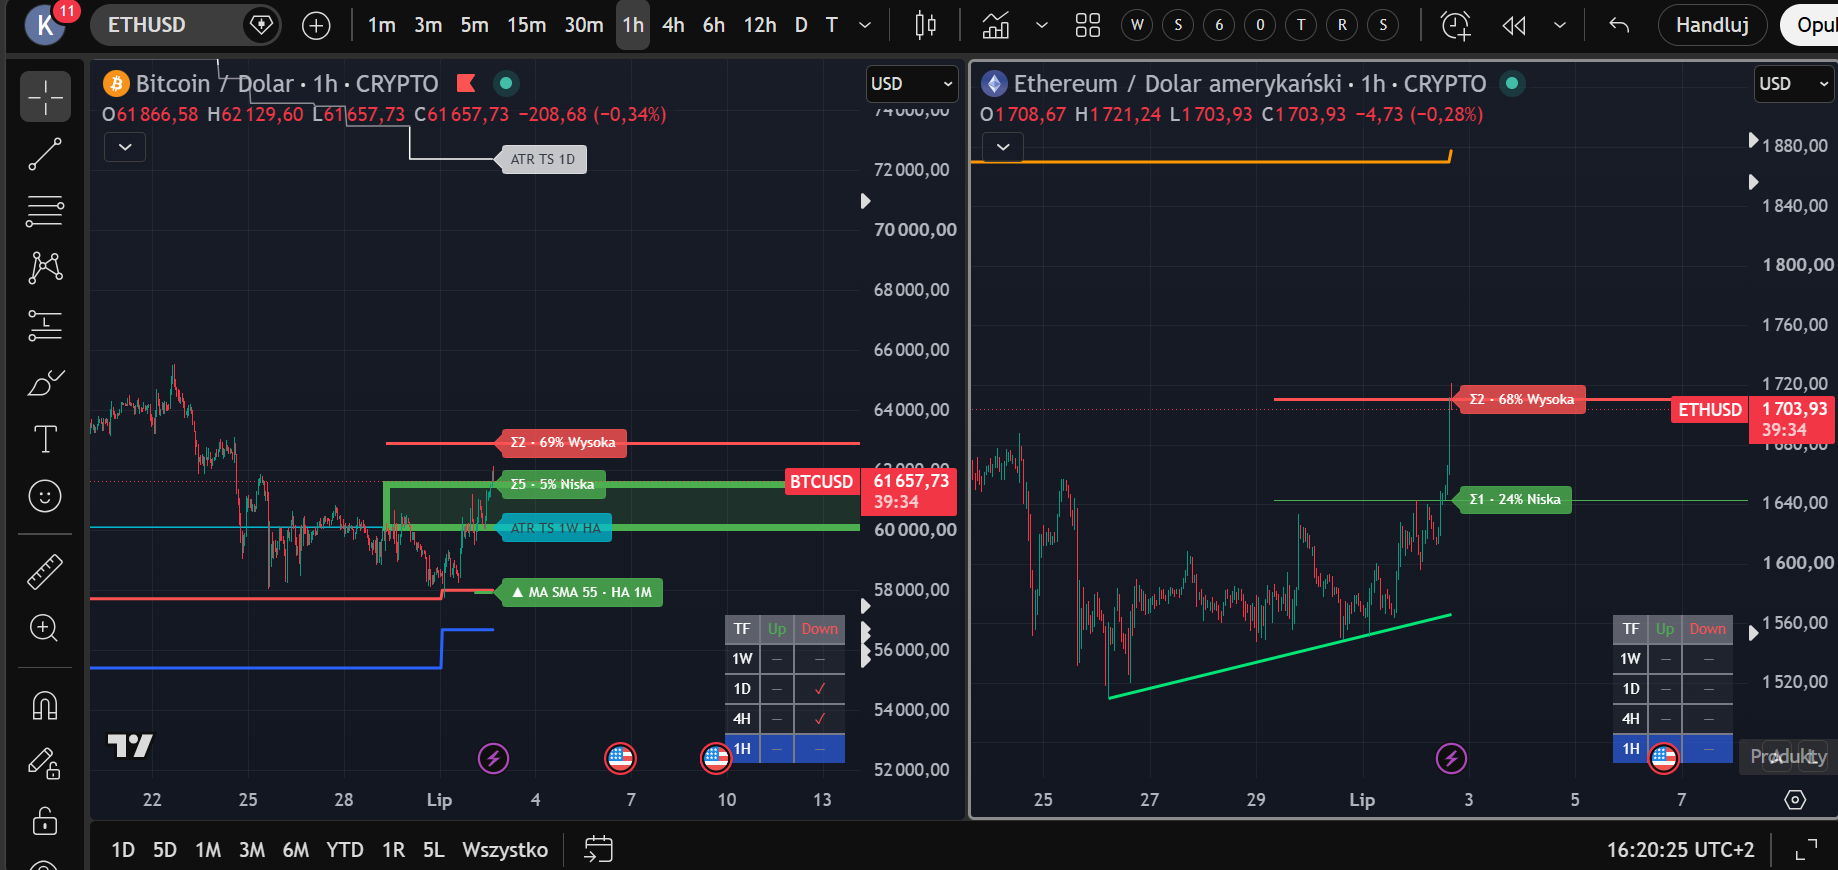
This is what the readout actually looks like
All the power on a single candlestick chart: levels from many timeframes at once — no switching — the active-trendline table in the corner, and zones computed on Heikin Ashi that you'd normally see only after changing the chart type. Two windows, BTC and ETH, give a full view of crypto's key zones, because the two markets influence each other.
02 · The target workspace
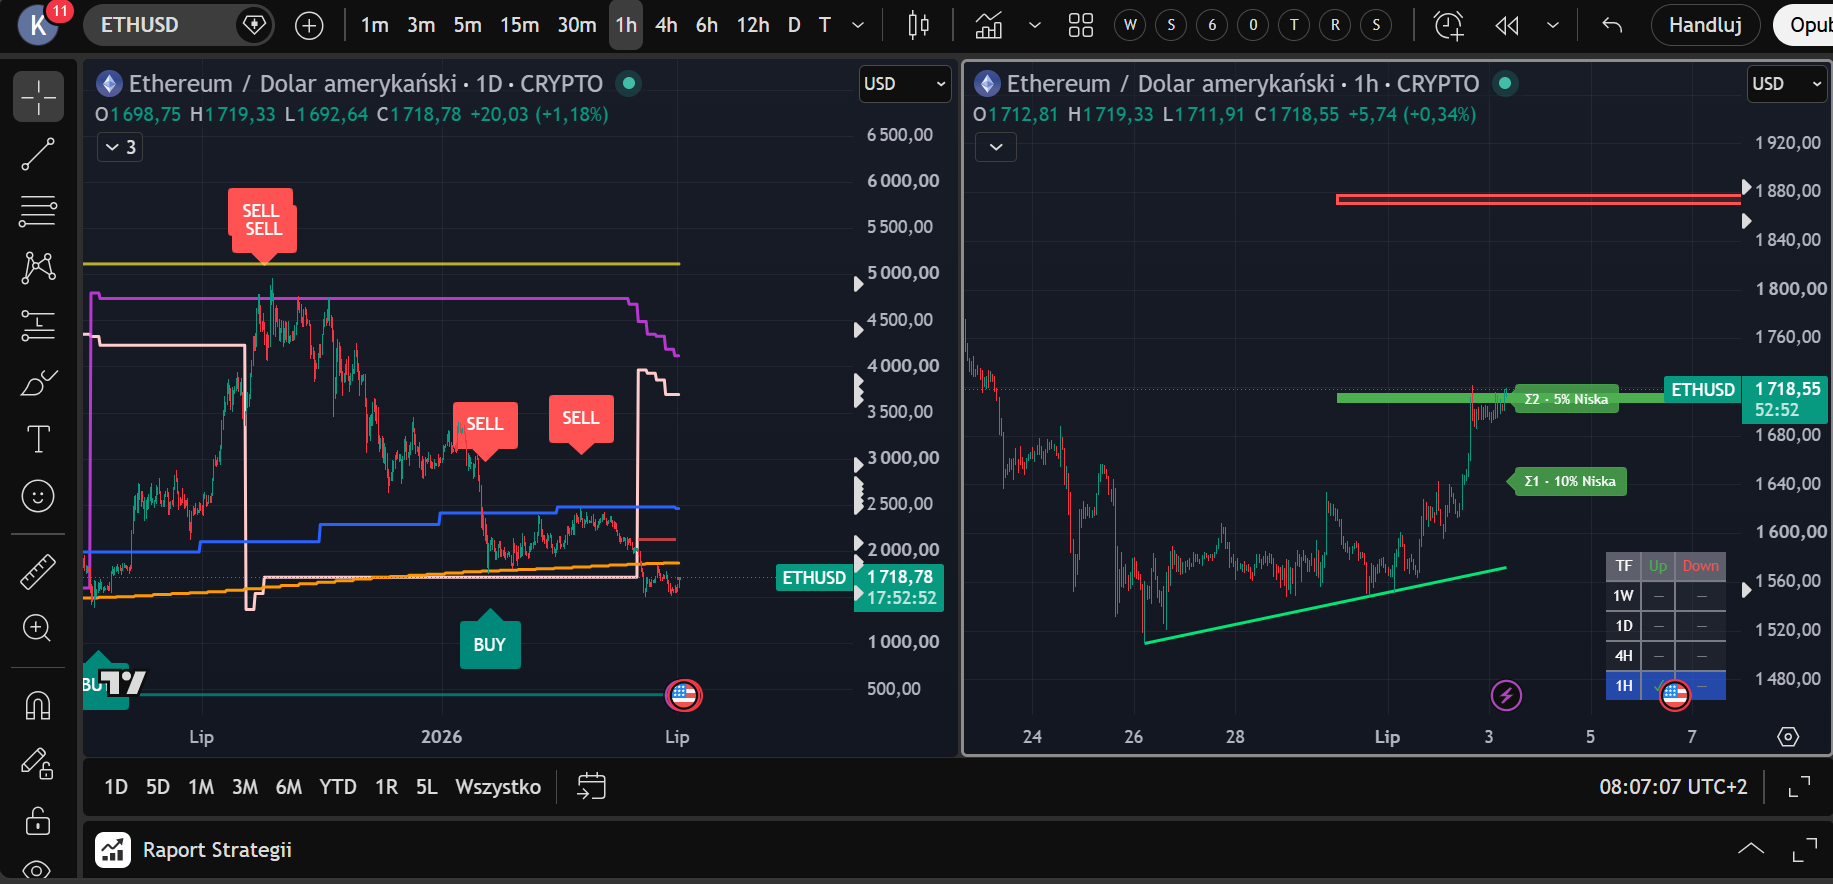
Context from afar. Zones up close.
This is the full-set workflow: the daily timeframe on the left with ATR strategy markers (context — who's driving the market; markers are generated by an algorithm under explicit rules and are not recommendations), 1h on the right with the zone sonar — which supports and resistances sit nearest to price and how likely they are to break. You decide where both views agree.
03 · Many markets at once PRO PLAN
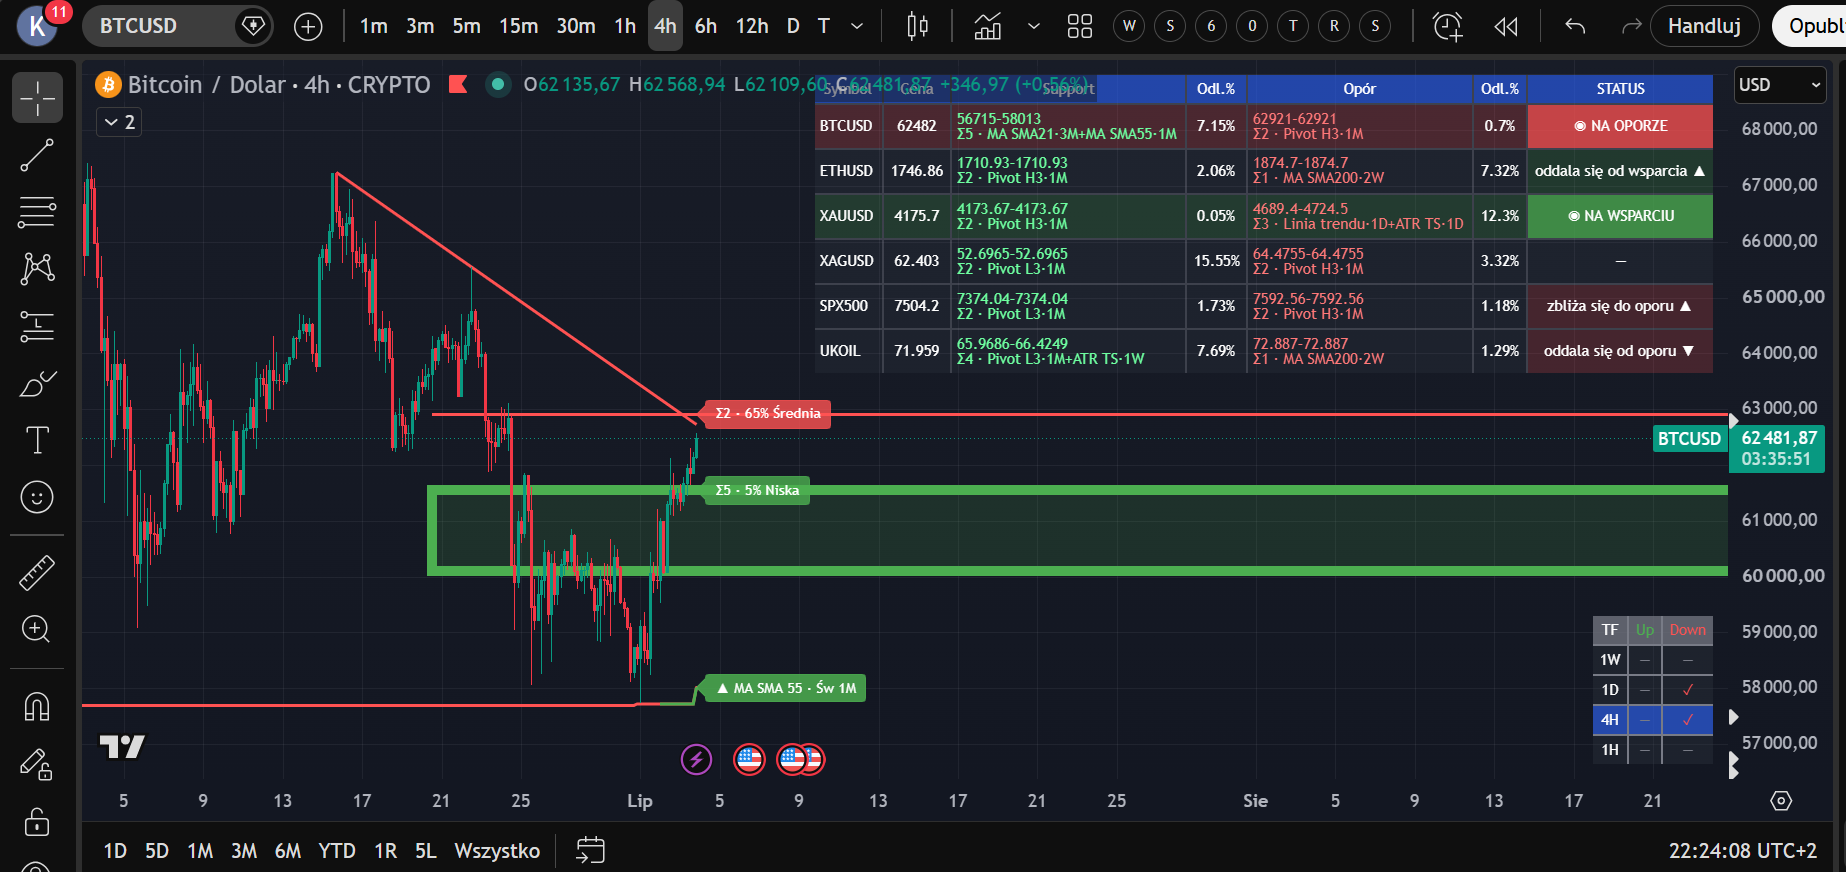
Eight markets. One table. Zero switching.
The Multi-Market S/R Screener watches up to 8 markets at once with the same zone engine as the dashboard — by default crypto, gold, silver, the S&P 500, oil and coffee. The STATUS column highlights a row when price sits on a key zone and tells you directionally whether price is approaching the zone or moving away; a single alert covers the whole set. If you trade across markets: the sonar watches all of them, you look only where something's happening.
04 · The readout in three steps
Not another indicator. An instrument for reading levels.
Nearby levels from multiple indicators merge into a single zone — instead of ten lines you see the areas that actually matter.
Each level scores by timeframe (12M=6 … 1D=1) and indicator type. Σ7 is a wall; Σ1 is a hint.
Trend pressure (ADX/DMI) versus zone strength, as a percentage: High ≥66, Medium ≥40, Low <40.
| Side | Zone | Sources | TF | Σ | Distance | Breakout chance |
|---|---|---|---|---|---|---|
| RES | 64 120 – 64 480 | ATR TS 1W + Camarilla H3 1M | 1W/1M | Σ7 | +2.6% | 68% · High |
| RES | 63 350 | MA 200 1D | 1D | Σ3 | +1.3% | 41% · Medium |
| SUP | 61 040 – 61 380 | Trendline 1W + ATR TS 1M | 1W/1M | Σ5 | −2.0% | 22% · Low |
| SUP | 59 800 | Camarilla L3 1W | 1W | Σ2 | −4.3% | 37% · Low |
Sample zone-table readout (illustrative data). On the chart you also get labels at levels and the nearest zone drawn as a box or line.
05 · Under the hood
What the sonar scans
Monthly and weekly trailing stops — the backbone of the trend read.
Type, timeframe and length of each MA set independently.
Monthly and weekly reversal levels.
Auto-detected (1W–1H) and counted into zone strength; a table shows where a line is active.
Ticker auto-detection; the second market confirms or weakens a zone — because BTC and ETH influence each other.
Zones computed on HA are visible without changing chart type — regular candles stay, HA levels join in.
Levels from 1M/1W/1D/4H/1H at once on one chart — you see confluence immediately, not after six TF switches.
Zone entry (support/resistance), breakout up/down.
06 · Course included
A tool without a method is just pretty lines
Every plan includes the course: how to read zones and Σ strength, how to interpret breakout probability, how to manage risk and position size — and what this tool willnot tell you. General educational content, no personalised recommendations.
Course outline →- 01Start: install and configure the dashboard
- 02S/R zones: where they come from and how to read them
- 03Σ strength and breakout chance in practice
- 04Risk management: position, stop, scenarios
- 05An analytical routine without watching screens 24/7
07 · Pricing
Try it first. No card.
7 days · no card
- ✓ Full S/R Dashboard
- ✓ Course module 1
- ✓ Expires on its own — zero commitment
yearly: €279 (−20%)
- ✓ The dashboard live on your chart
- ✓ 4 TradingView alerts
- ✓ Modules 2–5: working with the live readout
yearly: €470 (−20%)
- ✓ Everything in Standard
- ✓ Screener: 8 markets in one table + alerts
- ✓ The ATR strategy joins at no extra cost after validation
08 · FAQ
The questions you should be asking
?Are these buy/sell signals?
No. MarketSonar shows zones, their strength and breakout chance — analytically and educationally. Interpretation and decisions are yours. We do not provide investment advice.
?What do I need to start?
A free TradingView account. After purchase (or on trial) you give us your username and we grant invite-only access — the indicator appears in your scripts.
?Does the trial need a card?
No. Email plus TradingView username gets you 7 days of full access. It expires on its own — nothing to cancel.
?Which markets does it work on?
Developed and tested mainly on BTC/ETH and US blue-chip stocks. Technical S/R levels compute on any TradingView instrument.
?Does the indicator repaint?
Levels from a still-forming higher-timeframe bar can shift until that bar closes. We say this openly and teach you how to account for it. Honesty over a pretty backtest.